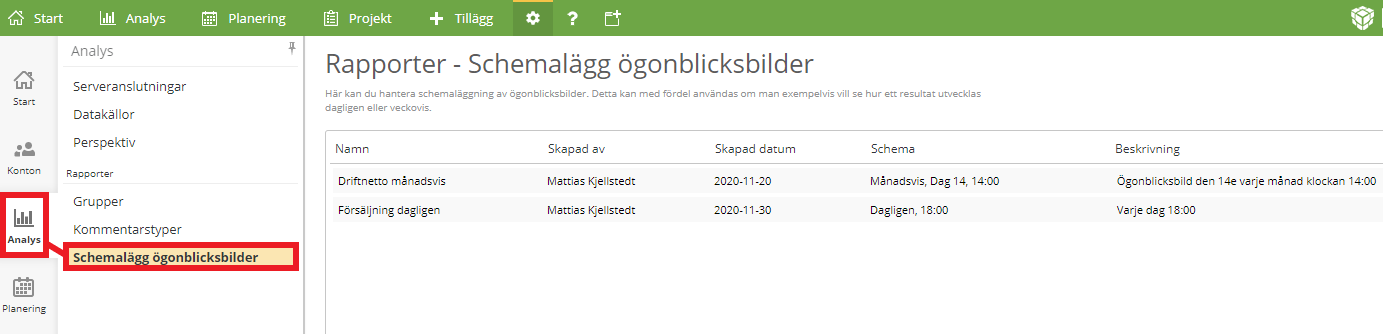
12.3 January 2024
Notifications
Notifications were launched in INSIKT Scorecard in 12.2 and are now being carried over to large parts of the product including Planning and Project.
Tagging
While writing a comment, you can add an “@” sign and INSIKT will help you find the right users to add to the comment. Then INSIKT will send a notification to that person.
Create and manage project version
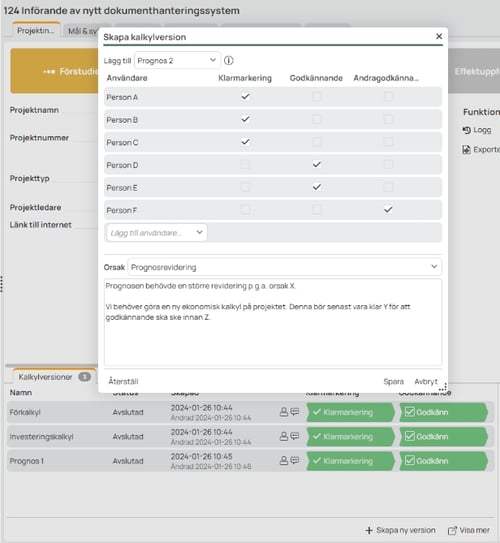
Creating and managing project versions has gotten a upgraded look and is now much faster.
Improvements in Scorecard
INSIKT Scorecard gets better everyday. Some examples of new improvements can be seen in access rights, filter activities and measures based on goals as well as better ways to write descriptions for goals.
12.2 October 2023
Notifications
Starting off in Scorecard, there is now a notification center in which users can find notifications related to different events around the product. Such as comments made on an activity you are responsible for or if someone tagged you in a comment.
This will be made available for all modules in upcoming versions.
Modernized comments in Planning and Project.
Comments in Planning and Project have been completely revamped and now uses a more easy to use interface.
New text editor
The text editor used for writing lists, attach images and more have been replaced with a new and improved editor. In the new editor, you can much easier edit tables, test links and tag users using the '@' sign. The new editor is now available in Scorecard but will be added to Project and Planning in the upcoming versions.
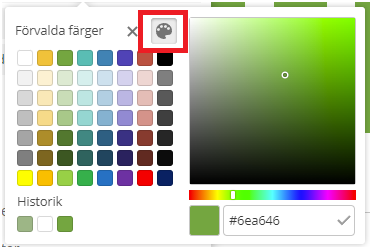
Custom color scheme
You can now create a custom color scheme to be used in tables and diagrams.
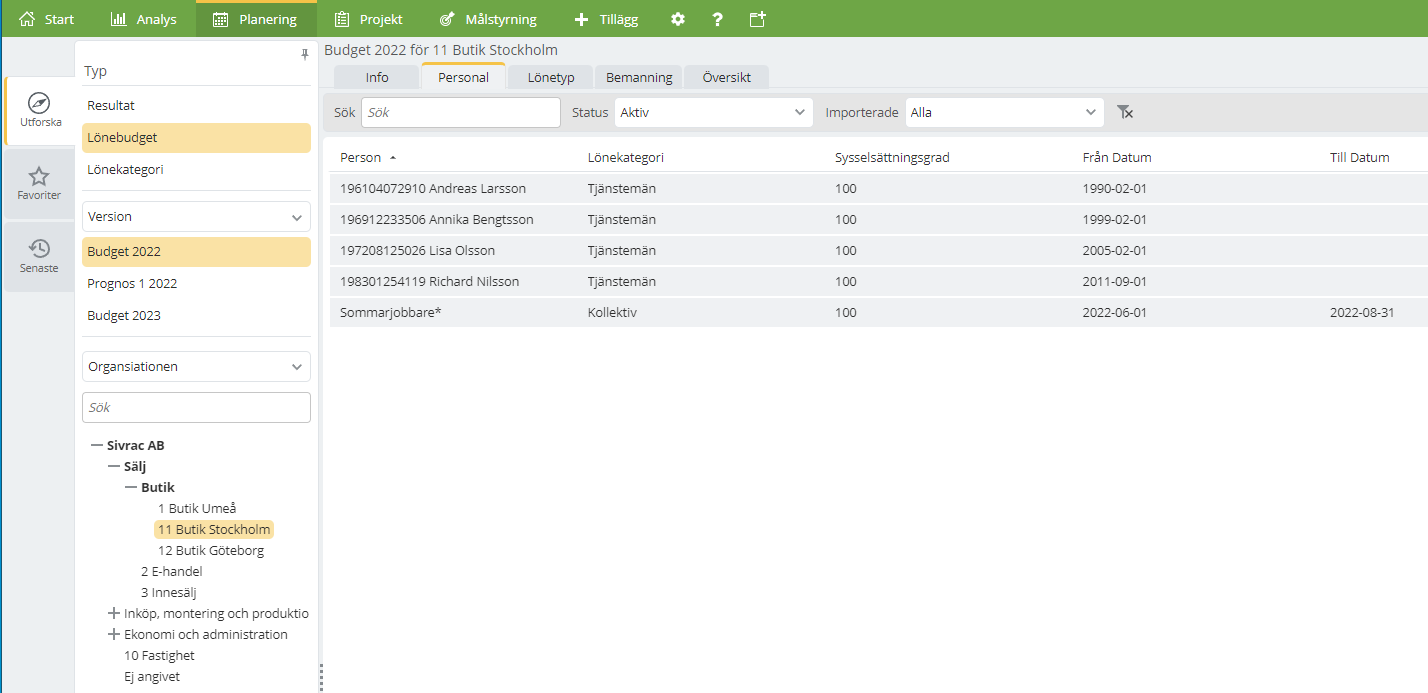
Version admin
Creating and managing planning versions (budgets, forecasts etc.) has gotten a more easy to use interface. The new interface also enables more adaptability than earlier.
12.1 June 2023
Version admin:
The creation and editing of planning versions (budget, forecast etc.) have gotten a new and improved interface. With this, you can also adapt it to which type of version you are creating.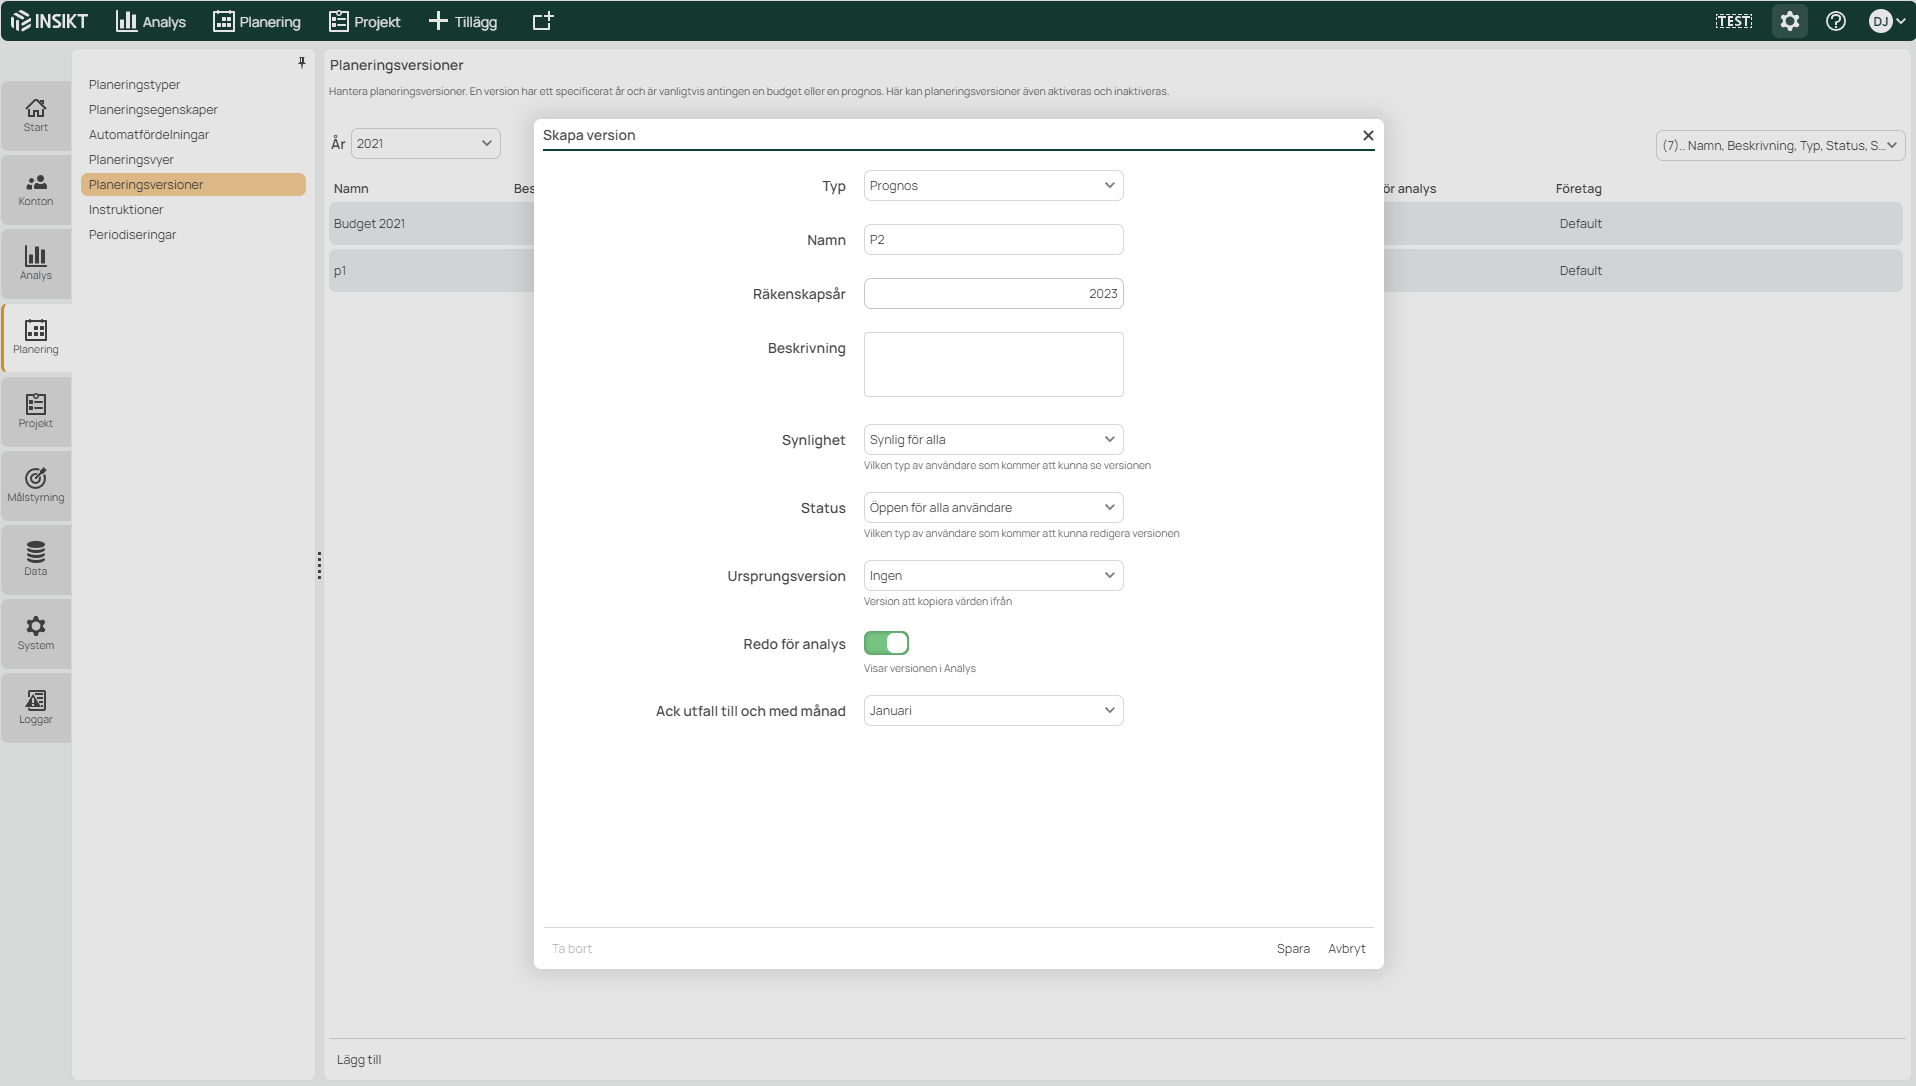
Aborting Heavy Report Loads
We've all been there... Accidentally clicking on the "heavy" report in the report tree, or selecting the All node in a large hierarchy and then refreshing the report. Then you get stuck in a large report load and can only navigate away from it when the report has been loaded. As of INSIKT 12.1, loading is interrupted if you change modules, select another report or otherwise navigate away from the report. The Refresh button is also changed to a Cancel button while reports are loading. If you click on this, the report loading will be interrupted.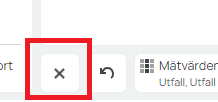
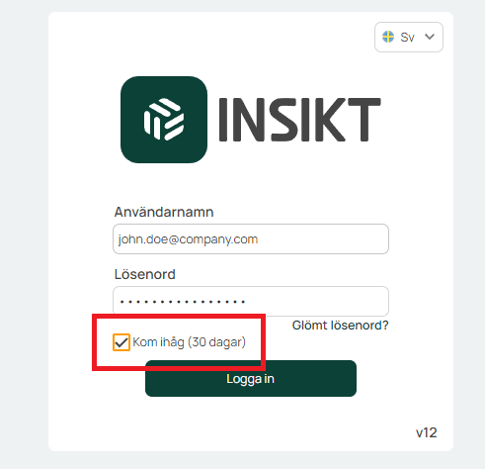
Remember me when logging in
Now there is the option to remain logged in. On the login box there is a "Remember me" check box for this. Certain criteria in the environment must be met for this function to be displayed and there is an option to turn off the function in the administration page.
Norwegian
Good news for our neighbors in the west, now there is INSIGHT in Norwegian! As a user, you can change the language directly on the login page, or under "My profile". In a first stage, we have named the language selection (beta) to signal that the translation is still being evaluated.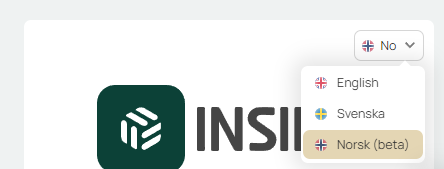
Horizontaly stacked bar charts
Support for "horizontaly stacked bar" charts, works exactly the same as stacked bar, but in landscape format.
Date format based on browser
Användare får nu det sitt datum och tidformat beroende på vad deras webbläsare är satt till. T.ex. ifall webbläsaren är satt till Amerikanska inställningar så får kunden AM/PM (10 am / 7 pm) och även datumformatet månad/dag/år (12/30/2023)
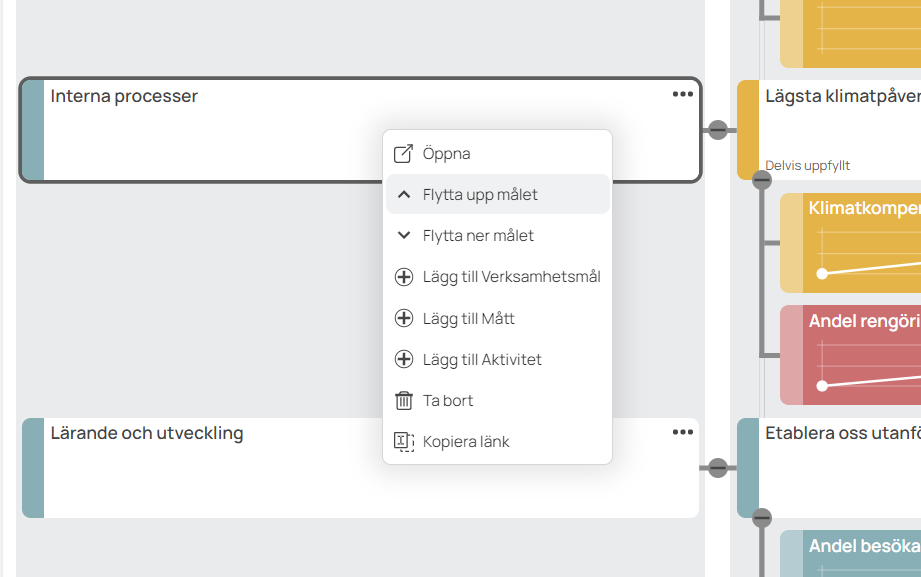
Change order in Scorecard
In the plan tab of the Scorecard module, you can now change the order among all goals, measurements and activities.
To be able to change the order, one must either be a department manager, admin or responsible for the above target to which the objects are linked. When you are a department manager/admin, you can only change the order of the objects that are linked to your department or a department below the one you are responsible/admin for.
The new order is saved automatically and will apply to all users.
This is done by right-clicking or clicking on the meatball menu.
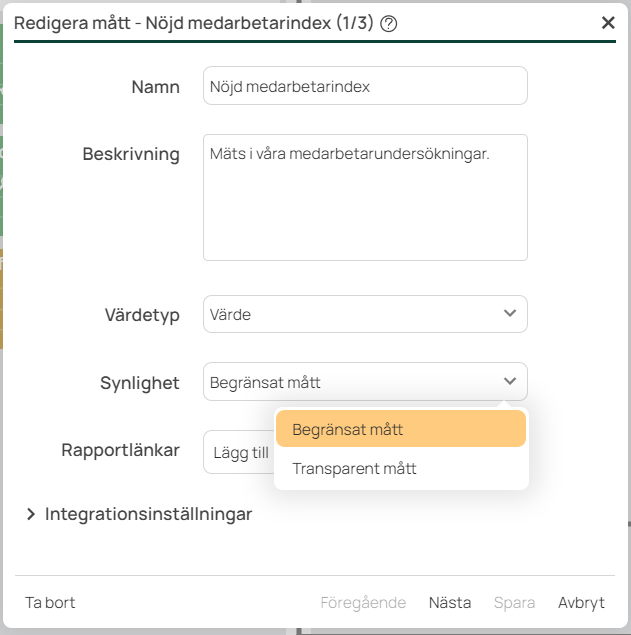
Limited measures
Now you can set a measure in the Scorecard module as limited. This means that all users will not be able to see the measure and its values. To be able to see the measure, the user must be linked in the "linked user organization" admin to the department in which the measure is located or to a superior department.
This limitation also applies if you have a transparent control model and if you have the measure as a report in the analysis module.
When a measure is limited, the outcome values must be "per department". If they were set to "whole organization" before, a warning will appear and they will automatically change if you continue.
Synchronise SAML/SSO-certificate from metadata-URL
Using the "Synchronization Metadata URL" setting, you can specify the metadata URL. Then INSIKT will synchronize the certificate every night. In this way, you as a configurator avoid manually updating certificates when these are renewed by the Identity Provider.%20(1).png?hsLang=en)
12 March 2023
New graphic profile
In INSIKTK 12.0, our graphical profile has been adjusted. This means:
- New main color in the top menu and logos.
- The font in insight has been changed from Open-sans to Manrope.
- New colors in the color palette, new column with new insight green as color scale has been added.
- New logo throughout insight. The favicon has also been changed to an svg that changes color depending on which theme is running in the browser.
- New design of module icons.
- Higher contrast on graphics that have been darkened (text and icons).
- Headings have become in semi-bold style.
- Lists under headings have been removed.
- INSIKT has got rounder corners and a different shade.
- The selection panel in analysis is now white.
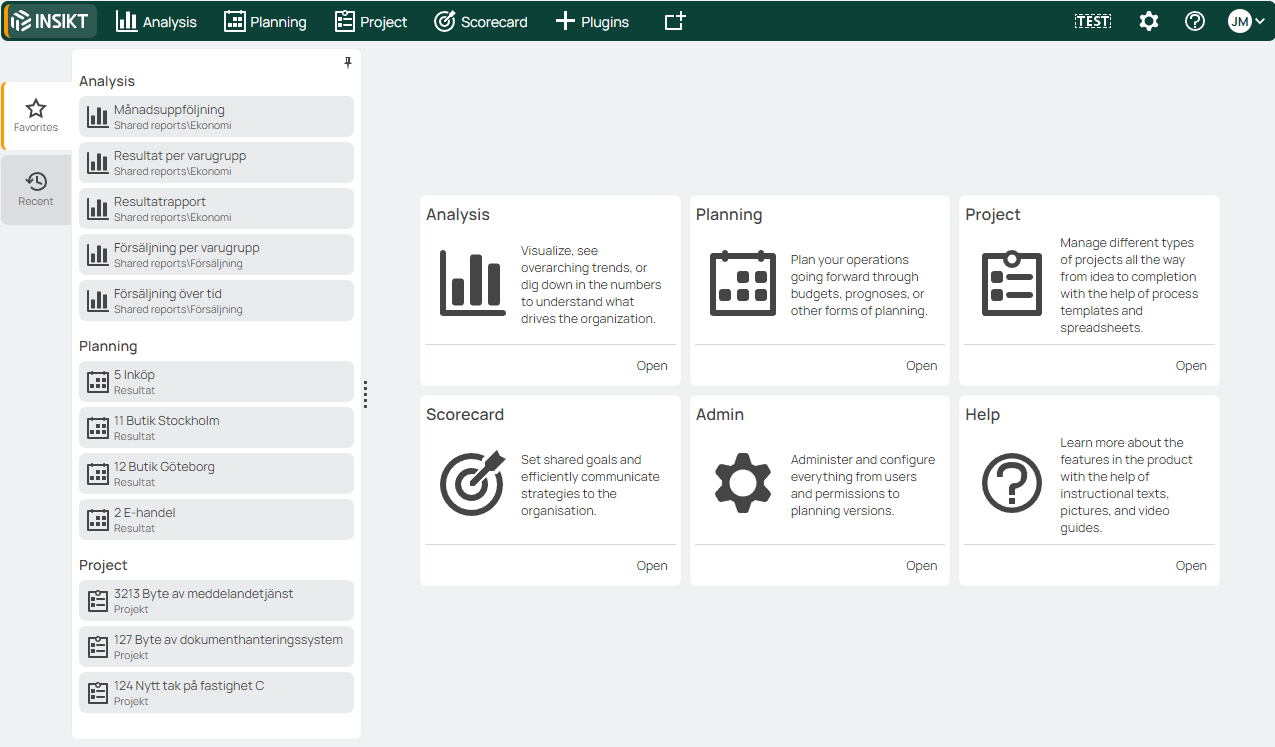
New home page
- Module groups are displayed as cards with icons and descriptions.
- Updated module admin interface where you can choose icons and set your own descriptions.
- Left panel on the home page with:
- Favorites tab with all favorites regardless of module
- Recent tab with all recently visited reports/projects/planning
Transparent and limited mode in Målstyrning
In the målstyrningsmodulen it is possible to choose whether a control model should be limited or transparent. This is selected in admin for control models.
Transparent – In this mode, everyone who is a target control user can see everything connected to this control model. That is, goals, measurements and activities in all parts of the organization.
Limited – If a control model is limited, you must have a user-organization connection for this control model, which of course can be created in "connect user-organization" admin. Then you can see all the goals, measures and activities that exist in the department you are connected to as well as its superior and subordinate departments. If all control models are limited and you have not received any connection to any department, you will not be able to see the goal control module at all, even if you have authorization as a goal control user.
Faster and more modern navigation in INSIKT
INSIKT's architecture is modernized and improved on an ongoing basis. In this version, we have taken a big step and turned INSIKTK into a so-called Single Page Application (SPA), which makes page navigations faster and improves the user experience.
Periodization/comment icon on non-writable cells
Now the accrual is shown on all accounts/input lines that have an accrual in the cube, even accounts and grouping levels that are not writable. Previously, the periodization was only shown on writable lines. The exception is that the accrual is not shown on calculations, which is a limitation we made because calculations are often not written to show correct accrual.
The comment icon is also displayed on all lines, so you can comment everywhere. The comment icon also appears on calculations, unlike accruals
Zero line in chart
In graphs, the zero line on the y-axis will always be plotted. That is, there will always be a solid line that goes through 0 on the y-axis. If a graph has two y-axes with different scales, two zero lines are drawn.
Copy report/project links via right-click

- Added/updated so you can copy links to reports when right-clicking. The same in the project, planning or goal management organization tree.
- If you paste the link into a rich text environment (e.g. in an email), the link will be "nice" (eg: Link to 1 Butik Umeå i INSIKT).
- Otherwise it becomes a normal url link.
Relative selection - "First period next year"
Added a new predefined selection "First period next year" in Relative selection. Based on the selection made, the first month/week/day/etc for the next year is also selected.
New functions in cell summation
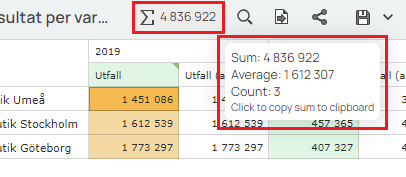
The sum when selecting several cells in a report has been expanded. It is now possible to click on the sum to copy it. If you hover over the sum, the average value and number of non-empty cells are also visible..
11.2
New add-on module
The plugin has been rewritten from the ground up with a new user interface. Even before, the configuration admin interface was new. Functionality the same as before but fresher, simpler and faster for the user. Also lays the foundation for future expansion and improvement on the new platform.
Security
INSIKT has received a new security function that prevents INSIKT from being embedded in other sites. Allowing such embedding completely freely can be used for clickjacking. To embed INSIKT, the page must be allowed first.
Filtered total in Show details
Now a subtotal is displayed when filtering the result in View Details. For example, if you filter out all the detail lines relating to account 3031, you will see the sum of these together with the total.

New options in relative selection
The following options are now available: "Last period previous year" and "First period next year".
11.1
Choose the order in which the steps of the report wizard should be displayed
Now you can choose the order in which the steps of the report wizard should be displayed to the user when the report is opened. The sorting can be changed when you save the report under "Save" -> "Save as...". Drag and drop steps to reorder before saving the report.
Scroll through the entire table report
In previous versions, users could only scroll in a table report's content section. In INSIKT 11.1, you as a user can scroll in the table, also in the table's header row/column sections.
Control which spreadsheet versions are available per tab
In INSIKT Projekt, different calculation versions can be displayed in different tabs. This can be used to simplify for the user. If this is of interest to you, contact the responsible consultant.
11.0
INSIKT Målstyrning – a completely new module!
With INSIKT Målstyrning all parts of the business are engaged and involved by making the overall goals of the business clear and connecting them with activities at all levels within the organization. Increase commitment and create transparency when all employees get a good overview of the common goals that the entire organization is working towards.
Create metrics and set target values linked to the organization's goals to ensure that these produce the desired effect. Supplement your gut feeling with numbers that prove you are heading in the right direction, or discover in time when a goal needs to be changed or improved.
Also check out our videos about Målstyrning:
Permissions for comments in Analysis
There is now a better possibility to organizationally control authorizations for comments in Analysis. This is configured via the "Link User-Organization" interface..
10.4
In this version, the focus has been on improving administration and security. New functionality comes instead in our next big release: INSIKT 11.0!
Relative time selection: Previous full year
A new relative time selection is available: "Previous full year".
Internet Explorer is no longer supported
Internet Explorer is no longer supported in this version of INSIKT. This version requires a modern browser such as Chrome or Edge.
10.3
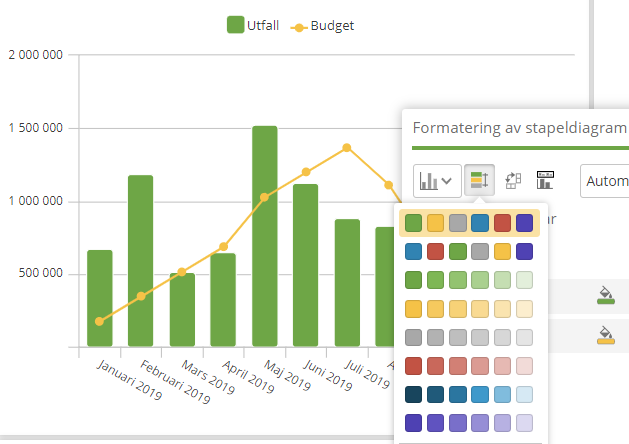
Improved chart formatting
Chart creation and formatting now follows the same standard as table formatting with a smaller floating box above the report surface. Changes in the diagram are visualized immediately, which makes it much easier to test a setting, see the result of the change and step by step to get to the desired end result.
Basically, the setting options are the same as before, but in a nicer and simpler format. There have also been some minor new features added for increased flexibility.
An example of a new visualization is the ability to display a pie chart with holes.
.png)
The video below shows an example of chart report creation.
New standard colors
INSIKT's standard colors have been updated to better fit INSIKT's color theme. It is the default colors that have changed and it is also still possible to choose other colors if desired.
For tabular reports, the new default colors are the right side in the image below. When upgrading, colors from previous default colors (left in the image below) will be corrected to a new shade of the same color in the new palette.
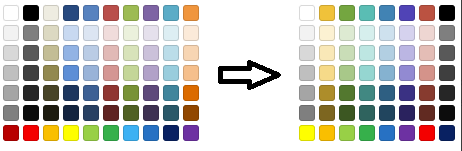
Note that it is possible to choose colors completely freely.
Even in charts, the default color themes are updated. As in tables, the color per series can be changed to a completely arbitrary color if desired.
Internet Explorer is no longer supported
Internet Explorer is no longer supported in this version of INSIKT. It is important that you have access to a modern browser such as Chrome or Edge.
10.2
Improved administration of connection between users and responsibilities
The administration function for linking users to responsibilities in a planning type (or project) has been modernized for a better overview and easier management of changed permissions.
.png)
Graphic refresh
Graphical improvements are made continuously in all versions, but in 10.2 a special effort has been made to align style.
Improved password management and breach management for users
Password changes and intrusion management have been improved. Among other things, the user is informed more clearly in the email "Logging in from a new device" about how he can take action if it was not him who logged in.
Summarization of selected cells
The sum of numbers in selected cells is displayed at the top of the report. A selection can be made in three different ways.
- Click and hold down the mouse button and drag over cells to be selected.
- Hold down the Shift key and select a range of cells.
- Hold down the Ctrl key and select specific cells..
For a sum to be calculated, at least two cells must be selected. The result is presented in the menu together with the other buttons, see picture below. The number can be copied by pressing the summation.
.png)
10.1
Advanced titles in reports
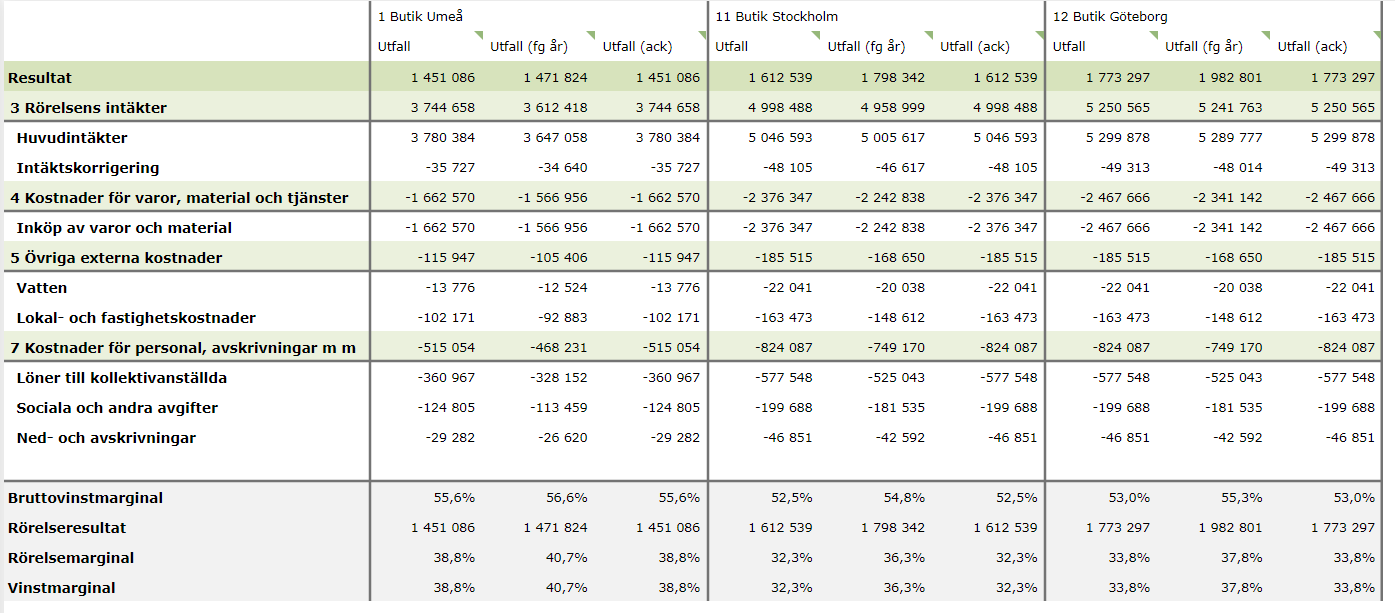
A title in a report or partial report can now contain the report's selection (e.g. selected month or selected department). In the image below, we see a report package with several tabs where each tab contains several parts (tables, charts, comments, images, ...). Such a report typically has a report guide that guides the user to select the period and department. The green selection panels show just as before which period and department are selected and of course allow the user to change selections.
New in INSIKT 10.1 is that the heading in the report can combine static text and selection from one or more dimensions. In the example below, we have the text "Monthly follow-up" and then the selected period, in this case "October 2020" and then the text "for" and finally the selected department. If the user changes to the next month, the report title is automatically updated.
The purpose of this is to more clearly communicate the current selection to the report user and reduce the need to add, for example, the selected period as a heading in the table. The latter has worked (and still works) to show the selected period clearly, but it makes the report more difficult to work with and also takes up valuable screen space.
.png)
The video below shows how we go about creating an advanced title as a report creator.
Borders in tables
Table report formatting can now also add clearer borders between rows and columns as well as remove or fade out the table's usual borders.
An example is shown in the image below where border lines clarify the account class headings, divide the section with key figures at the bottom of the table and divide the departments into clear column sections.
The video below shows how the Report Builder controls the borders of a table.
Report scaling/Zoom in reports
INSIKT includes the report zoom feature that can be used in analysis reports, planning input sheets, and project calculations. Using this feature, the user can control how much zoom is applied to the report. Zoom settings are saved per analysis report or planning tab in the browser, so the next time you open the same report, the zoom settings will be loaded.
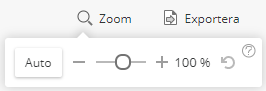
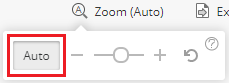
The Zoom feature is found above the report displayed. The feature can be used in two modes: Manual Zoom and Auto Zoom. These modes cannot be combined.
Manual zoom
Using the slider and the plus and minus buttons, you can manually control how much zoom is applied to the report. If this is used, auto zoom cannot be used.
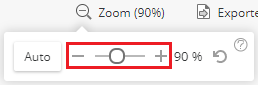
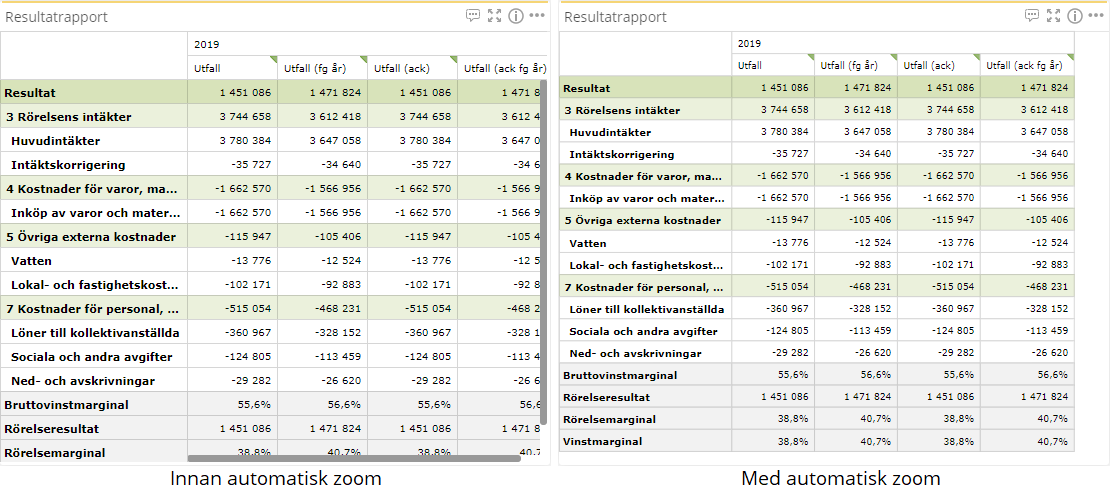
Automatic zoom
The user can let INSIKT decide for itself how much zoom to apply by clicking the Auto button. In this mode, INSIKT will individually loop through all tabular reports in the report and attempt to apply zoom so that all columns and rows of that tabular report can be displayed simultaneously (without scrolling). If the tabular report has many more rows or columns than its surface can display, INSIKT will not apply zoom to this report (to avoid zooming the report too far to make it unreadable). If the tabular report has many more rows than the height of the surface can show, INSIKT will instead try to zoom the report down so that all the columns are shown, and vice versa.
If auto zoom is enabled, manual zoom cannot be used.
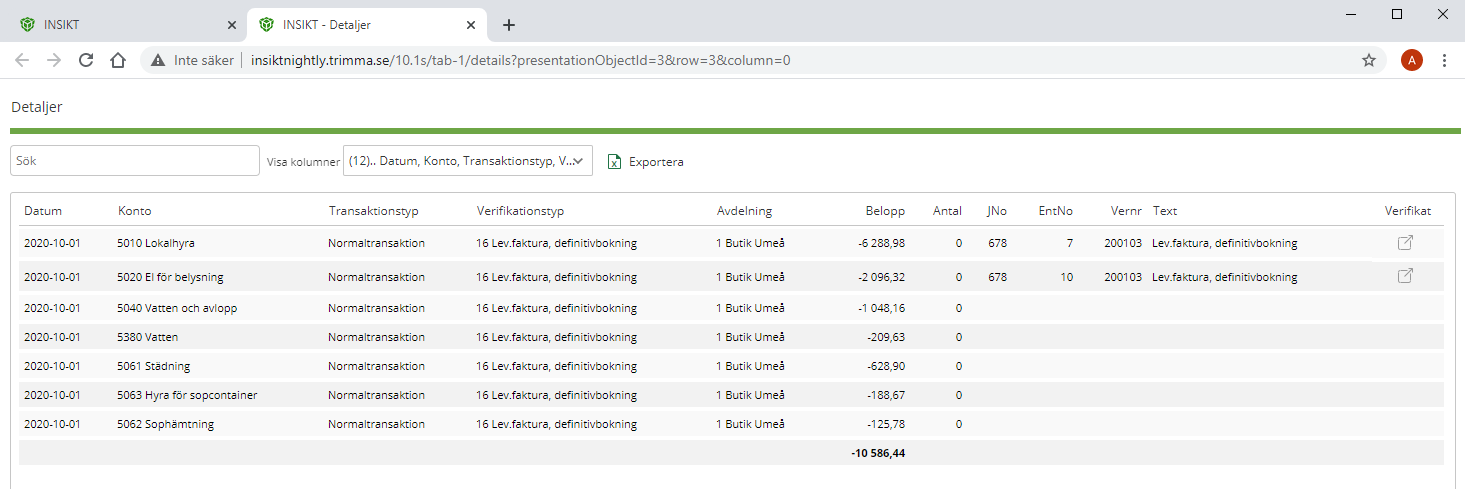
Modernization of show details
Nya visa detaljer är fräschare och snabbare i utseendet, förenklar sökning samt ger mer plats åt innehållet eftersom fönstret öppnas i en ny webbläsarflik. Observera att det fortfarande går att flytta fliken till en annan skärm för att se rapporten och detaljerna samtidigt. Nya funktionen döljer också kolumner som är tomma för att ge mer plats åt det som faktiskt är viktigt.
Uppfräschning av användarupplevelse
Ett flertal funktioner har fått ny grafisk design och förbättrad användarvänlighet. Några av dem syns i bilder nedan.
Administration av planering
It is now easier to change, for example, writability and character control for several accounts at the same time by right-clicking on an entire account grouping. It is also quick and easy to search for a particular account.
Maintenance of automatic distributions is also possible in INSIKT Admin. Here, however, it is important to agree with the consultant how existing distributions are affected by a change.